Designing A Smarter Home For Zigbee Devices

software design   accessibility design
Colorful illustrated workshop with vintage tech, computers, meters, a fridge, desk, yellow chair, and wall-mounted devices.
This case study reimagines work developed under a prior NDA. The strategic thinking and design approaches are my own, and the visual elements have been adapted to eliminate any identifiable connections to the original materials.

my role

Lead UX Designer

additional roles

One ux researcher, one product manager, two engineers

In the world of smart home technology, the Zigbee protocol is quickly becoming ubiquitous. For this client, a leader in the smart home industry, integrating Zigbee devices into their industry-leading installation and monitoring software became a top priority.

Seamlessly integrate Zigbee device support into the company’s existing installation and monitoring software, ensuring interoperability while improving dealer workflows.

To support the integration of Zigbee devices, a dedicated dashboard was developed to give technicians real-time visibility into device connectivity, signal strength, and mesh network structure.

This dashboard included:

  • Monitoring Zigbee device health and communication status
  • Visualizing overlap between interfering technologies
  • Identifying weak links or dropped nodes
  • Managing firmware updates across all connected Zigbee devices
  • New data visualizations for Zigbee-specific device metrics

discovery phase

The discovery phase began with understanding Zigbee devices and their communication protocols. This was critical to determine how users would interact with the data and what information they would need.  

what is Zigbee?

Zigbee is a wireless communication standard specifically designed for low-power, low-bandwidth devices. Unlike Wi-Fi or Bluetooth, which often focus on high-speed data transmission, Zigbee is optimized for smart home devices that don’t need to send a lot of data, like, smart bulbs, sensors, and door locks.

why use Zigbee?

Manufacturers choose Zigbee over Wi-Fi for several reasons:

lower power consumption

Zigbee is much more power-efficient, allowing battery-powered devices like sensors or smart locks to last months or even years on a single battery.

mesh networking

Zigbee devices can form a mesh network, where each device relays signals to others. This helps extend the range of the network and provides more reliable coverage.

minimal bandwidth usage

Zigbee operates in a way that doesn’t need as much data transfer as Wi-Fi, which makes it ideal for simple, low-bandwidth tasks like turning on lights or reporting sensor status.

dedicated communication

Devices can communicate directly without depending on a crowded home Wi-Fi network. This helps reduce interference and ensures that smart home devices remain responsive.
Floor plan showing a Wi-Fi router connecting devices like laptops, printers, and smart appliances throughout a home.
WiFi network: In a typical Wi-Fi network, devices connect directly to a central access point (router) to access the internet and communicate with each other.
Floor plan showing a Zigbee hub connecting lights, fans, sensors, and devices in a mesh network across a home.
Zigbee mesh network: In a mesh network, a hub (controller) can communicate directly with a device or relay messages through other devices to reach its destination.

user personas

Based on the constructed user persona, the Zigbee page would need to include:
  • A clear overview of network health
  • Quick access to faulted devices
  • A comprehensive device list
  • User-friendly organization
  • Actionable data and tools
Persona profile of Ethan Nexus, a 32-year-old smart home technician with tech skills, motivations, frustrations, and daily routines.

design phase

The design phase focused on developing an interface that addressed user needs, followed by a late-phase round of user testing to ensure the design effectively met those requirements.

metrics

While integrators required both high-level and detailed metrics, displaying all available data would be overwhelming.
Zigbee dashboard showing network/device health, capacity, packet drops, and critical status alerts by controller.

frequency overlap

An added feature included a diagram that visualized the overlap between WiFi and Zigbee channels. Unlike typical illustrative visualizations, this diagram was designed to scale.
Wi-Fi and Zigbee channel overlap chart, highlighting optimal Zigbee channels and interference risks.
In addition to illustrating the overlap, the diagram also provides integrators with guidance on which channels may be most suitable for Zigbee mesh networks.

controllers

Zigbee mesh networks start at a central controller. Previously, these controllers were displayed on a separate screen, but incorporating them into this screen provided integrators with a more unified and efficient experience.
Table listing Zigbee mesh networks with health status, latency, channel, and capacity metrics.

faults

The top faulted Zigbee devices list highlights the devices that may be experiencing issues beyond the typical challenges associated with Zigbee networks.
Table of Zigbee devices with signal issues, showing errors, RSSI, route quality, battery, and latency.

all Zigbee devices

The new interface displays all Zigbee devices directly, eliminating the previous need to filter through a large, disparate collection on a central device screen.
Complete Zigbee device list with health metrics including RSSI, route quality, battery, and reboot frequency.

user testing

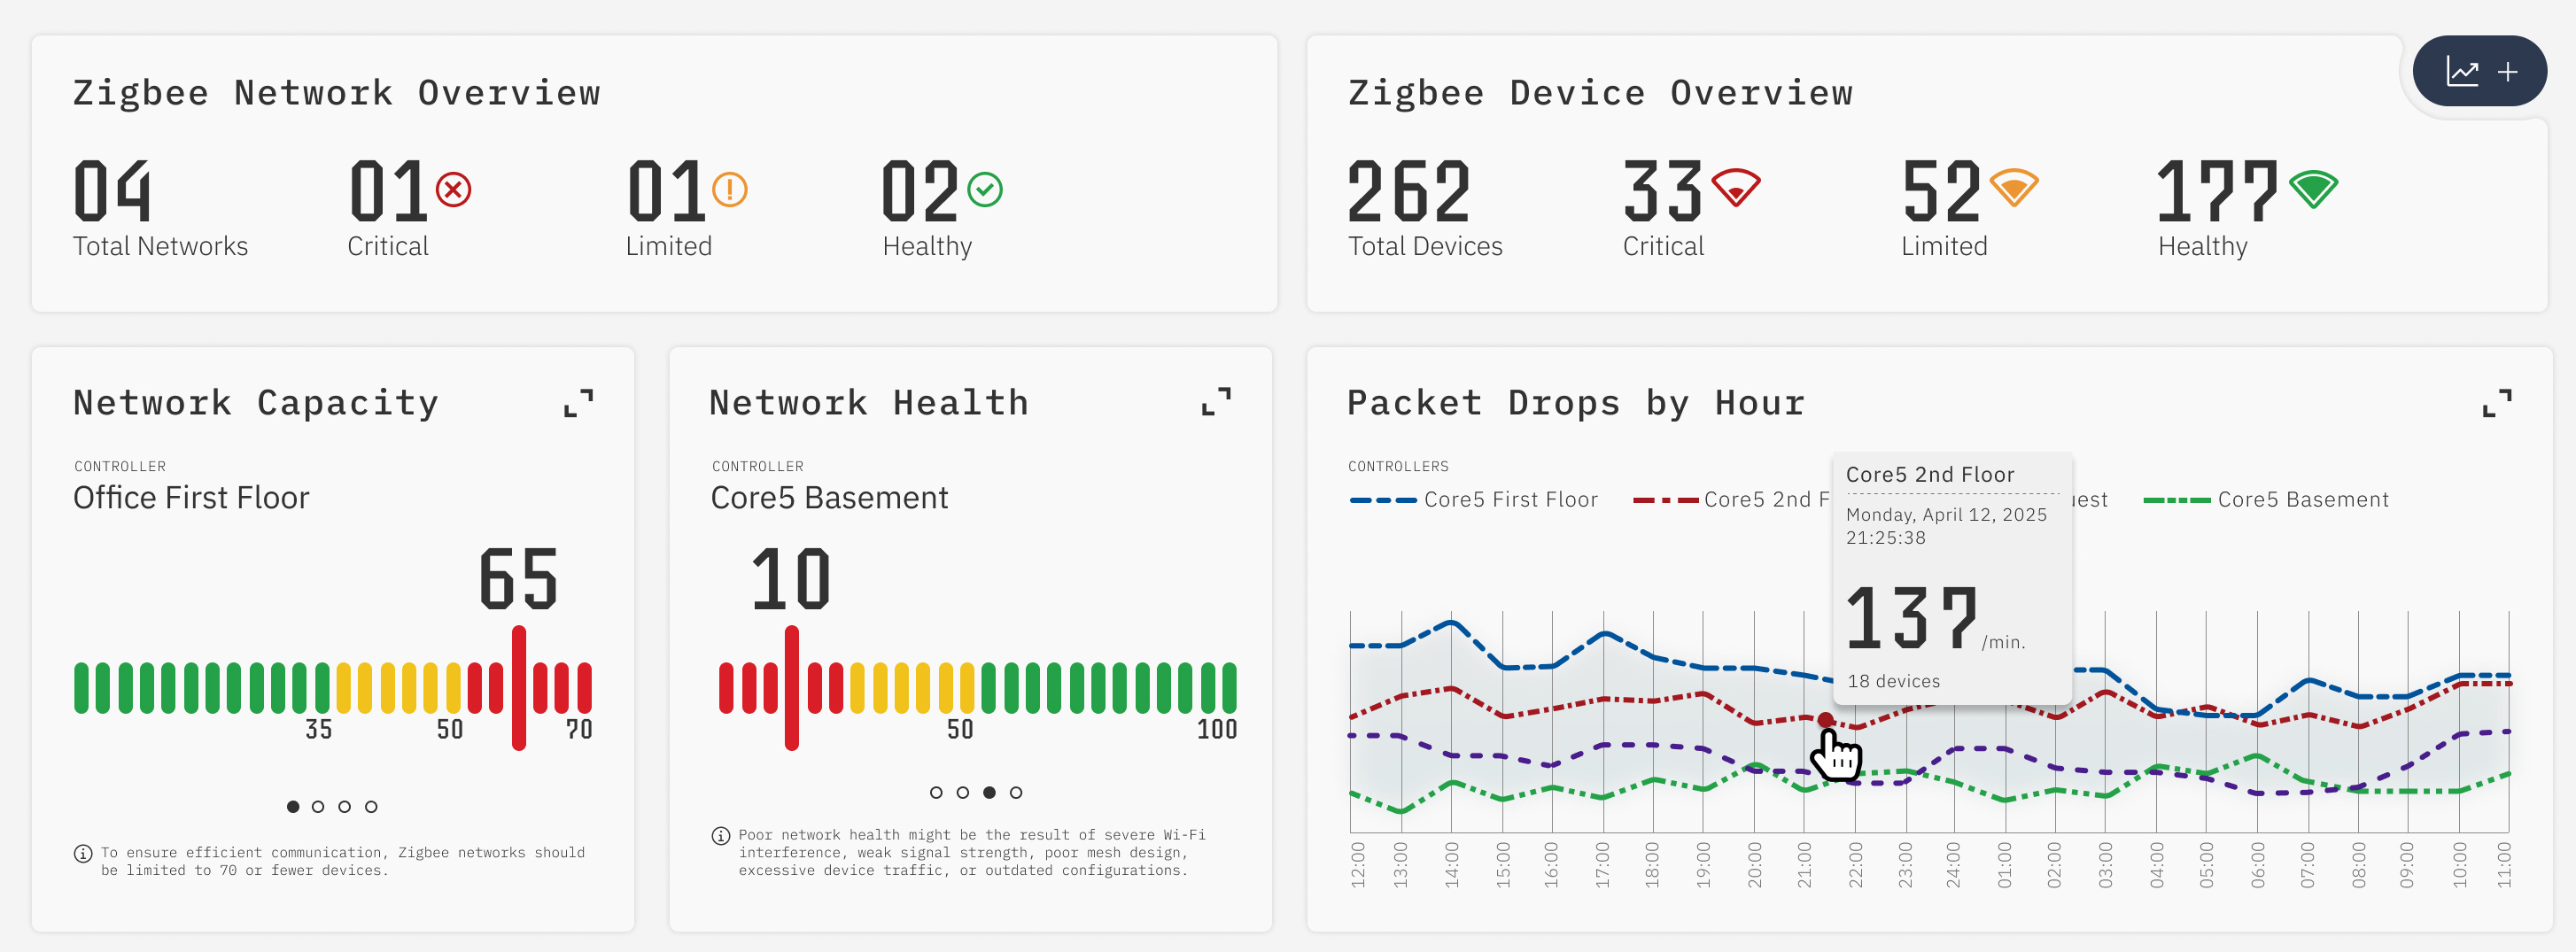
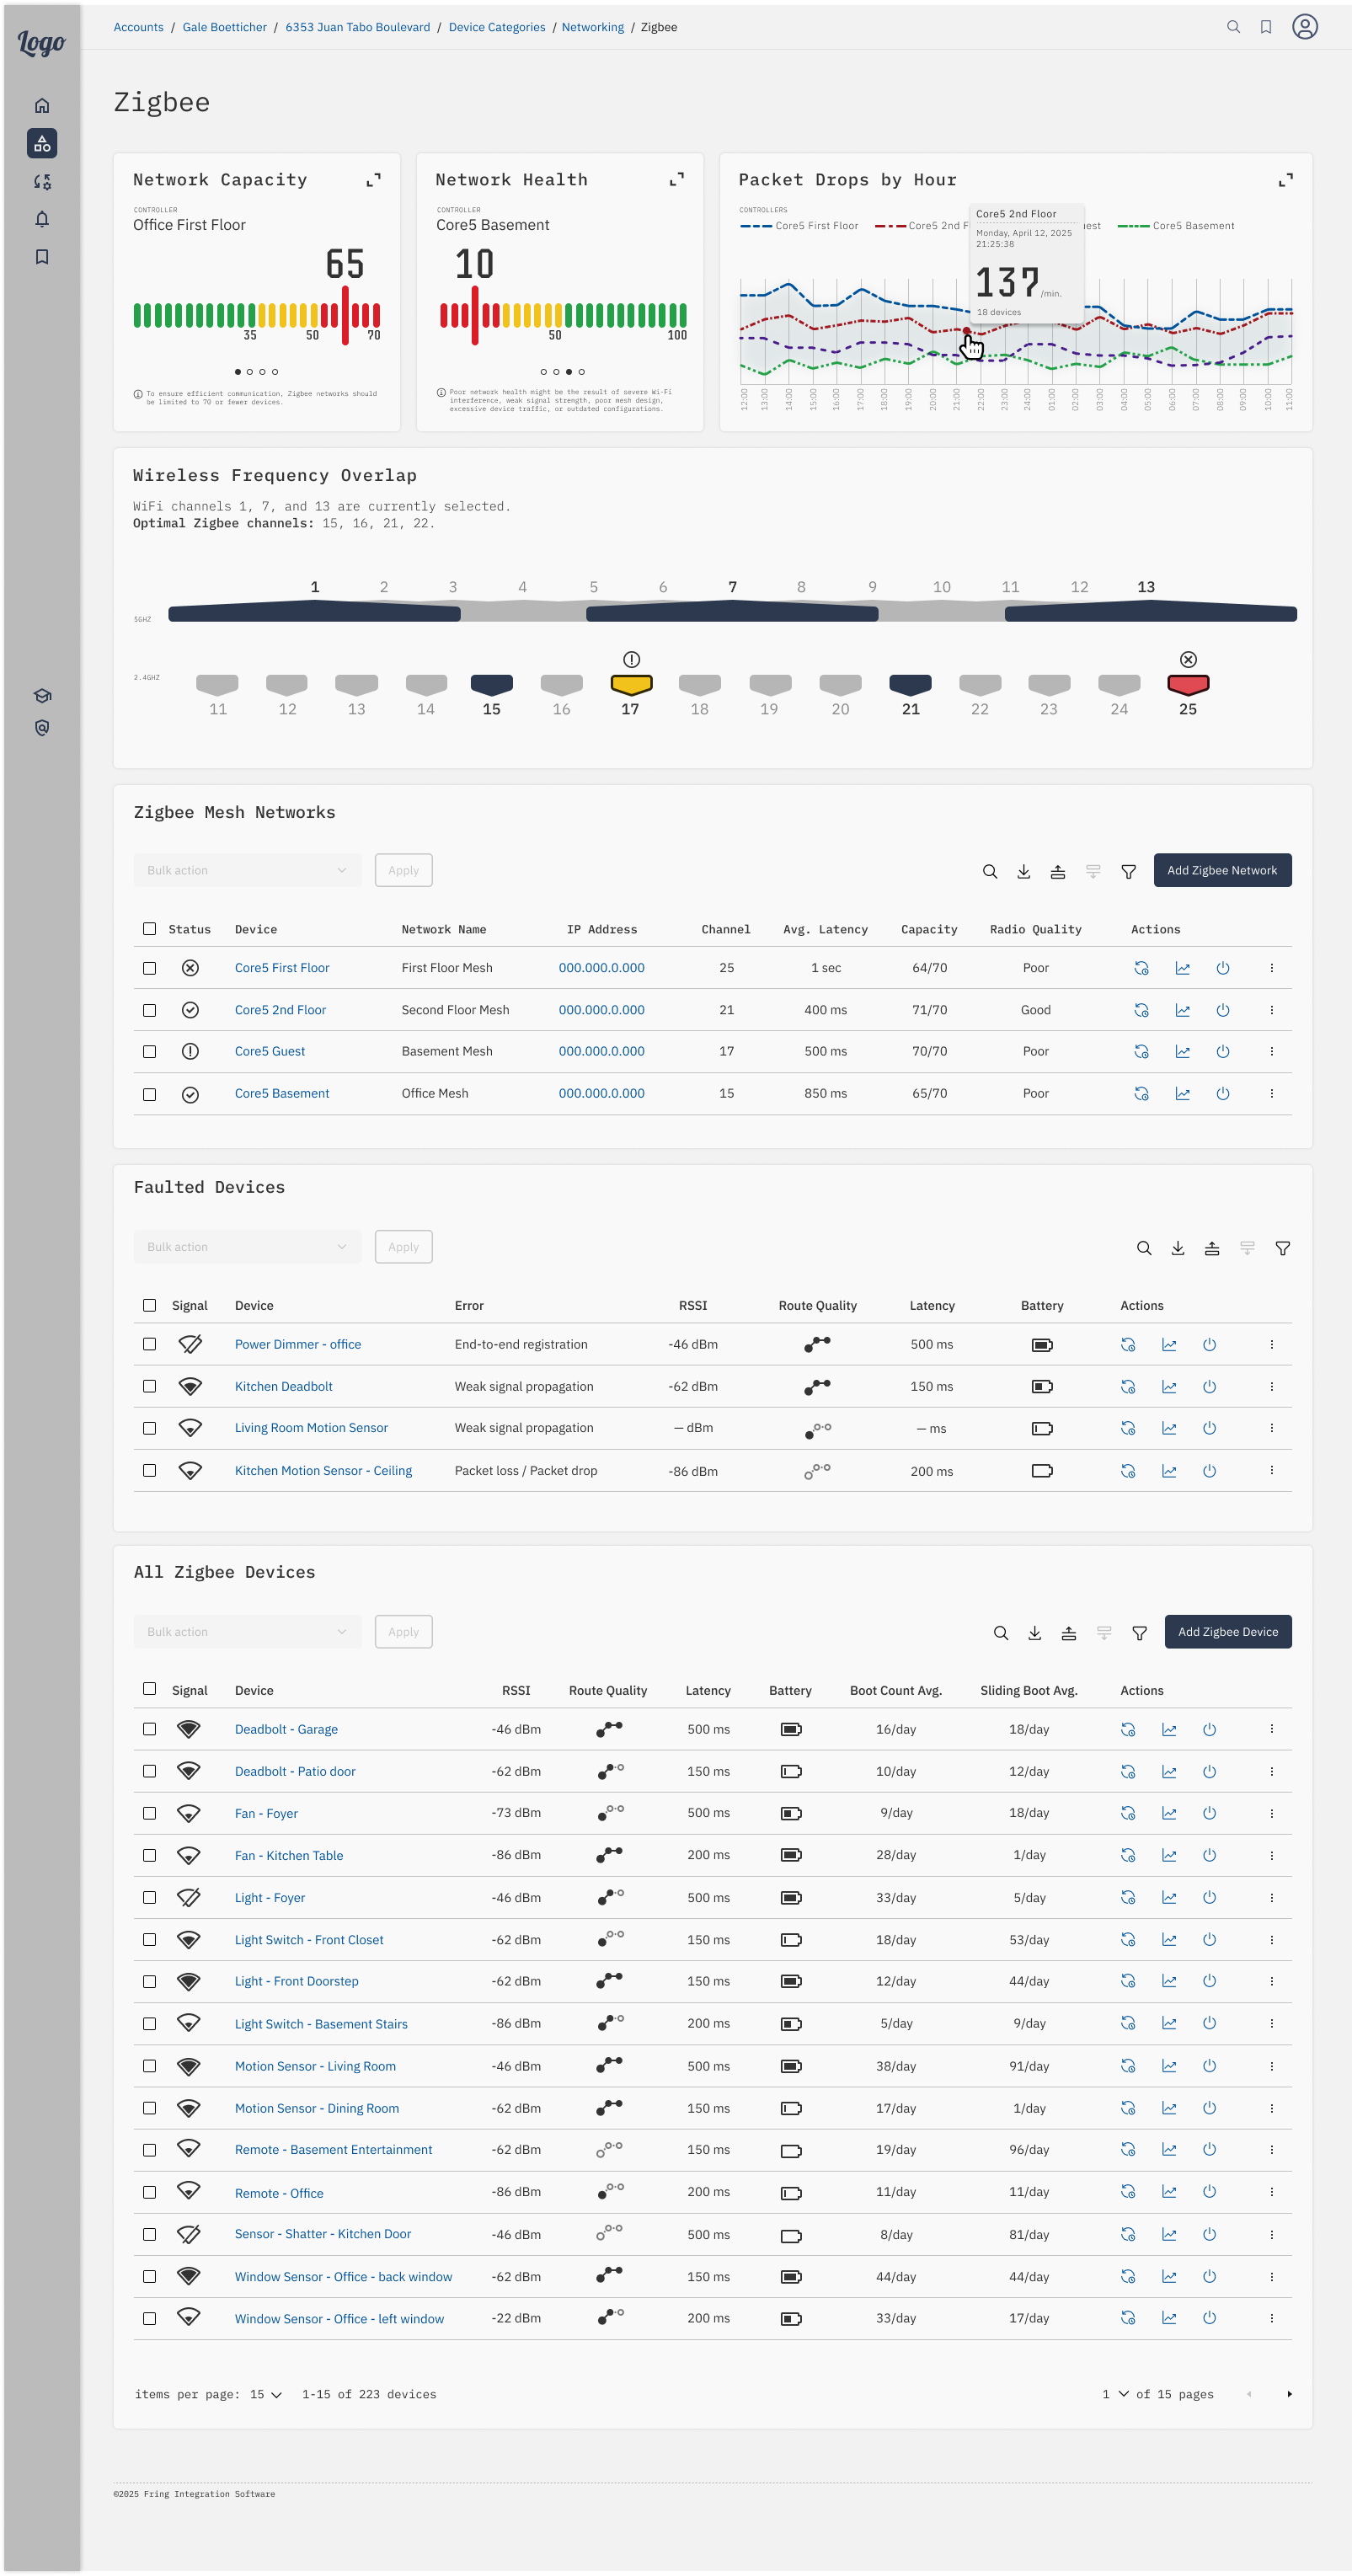
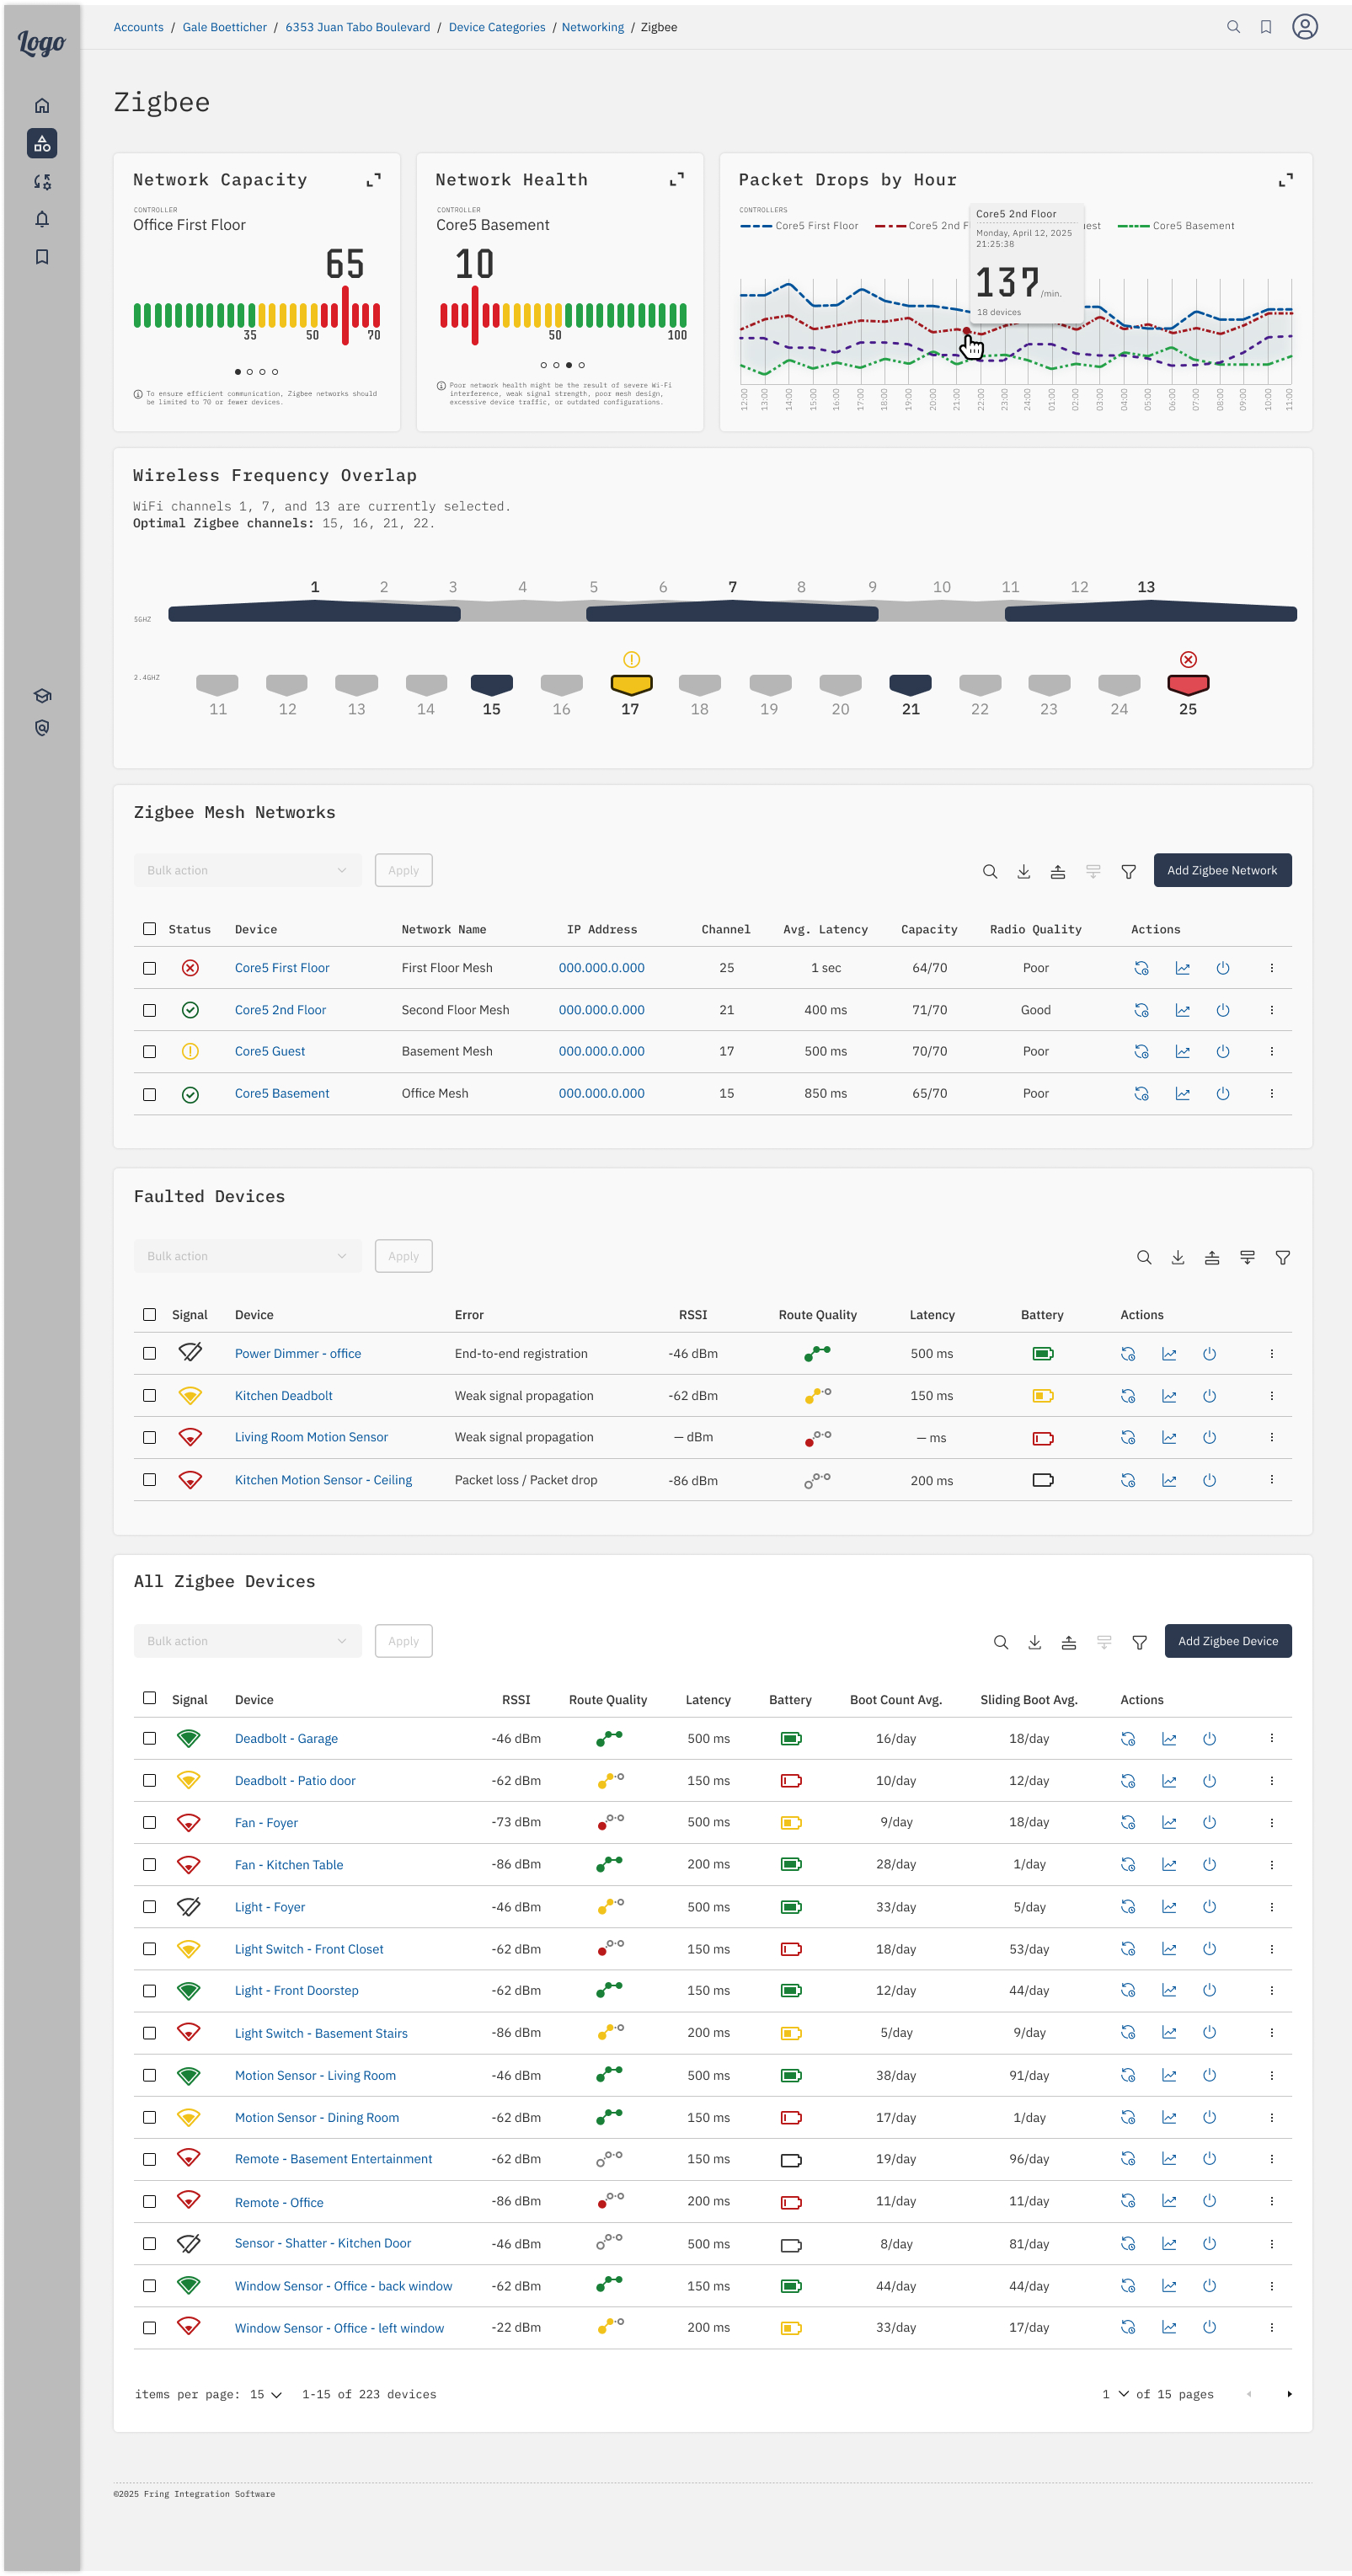
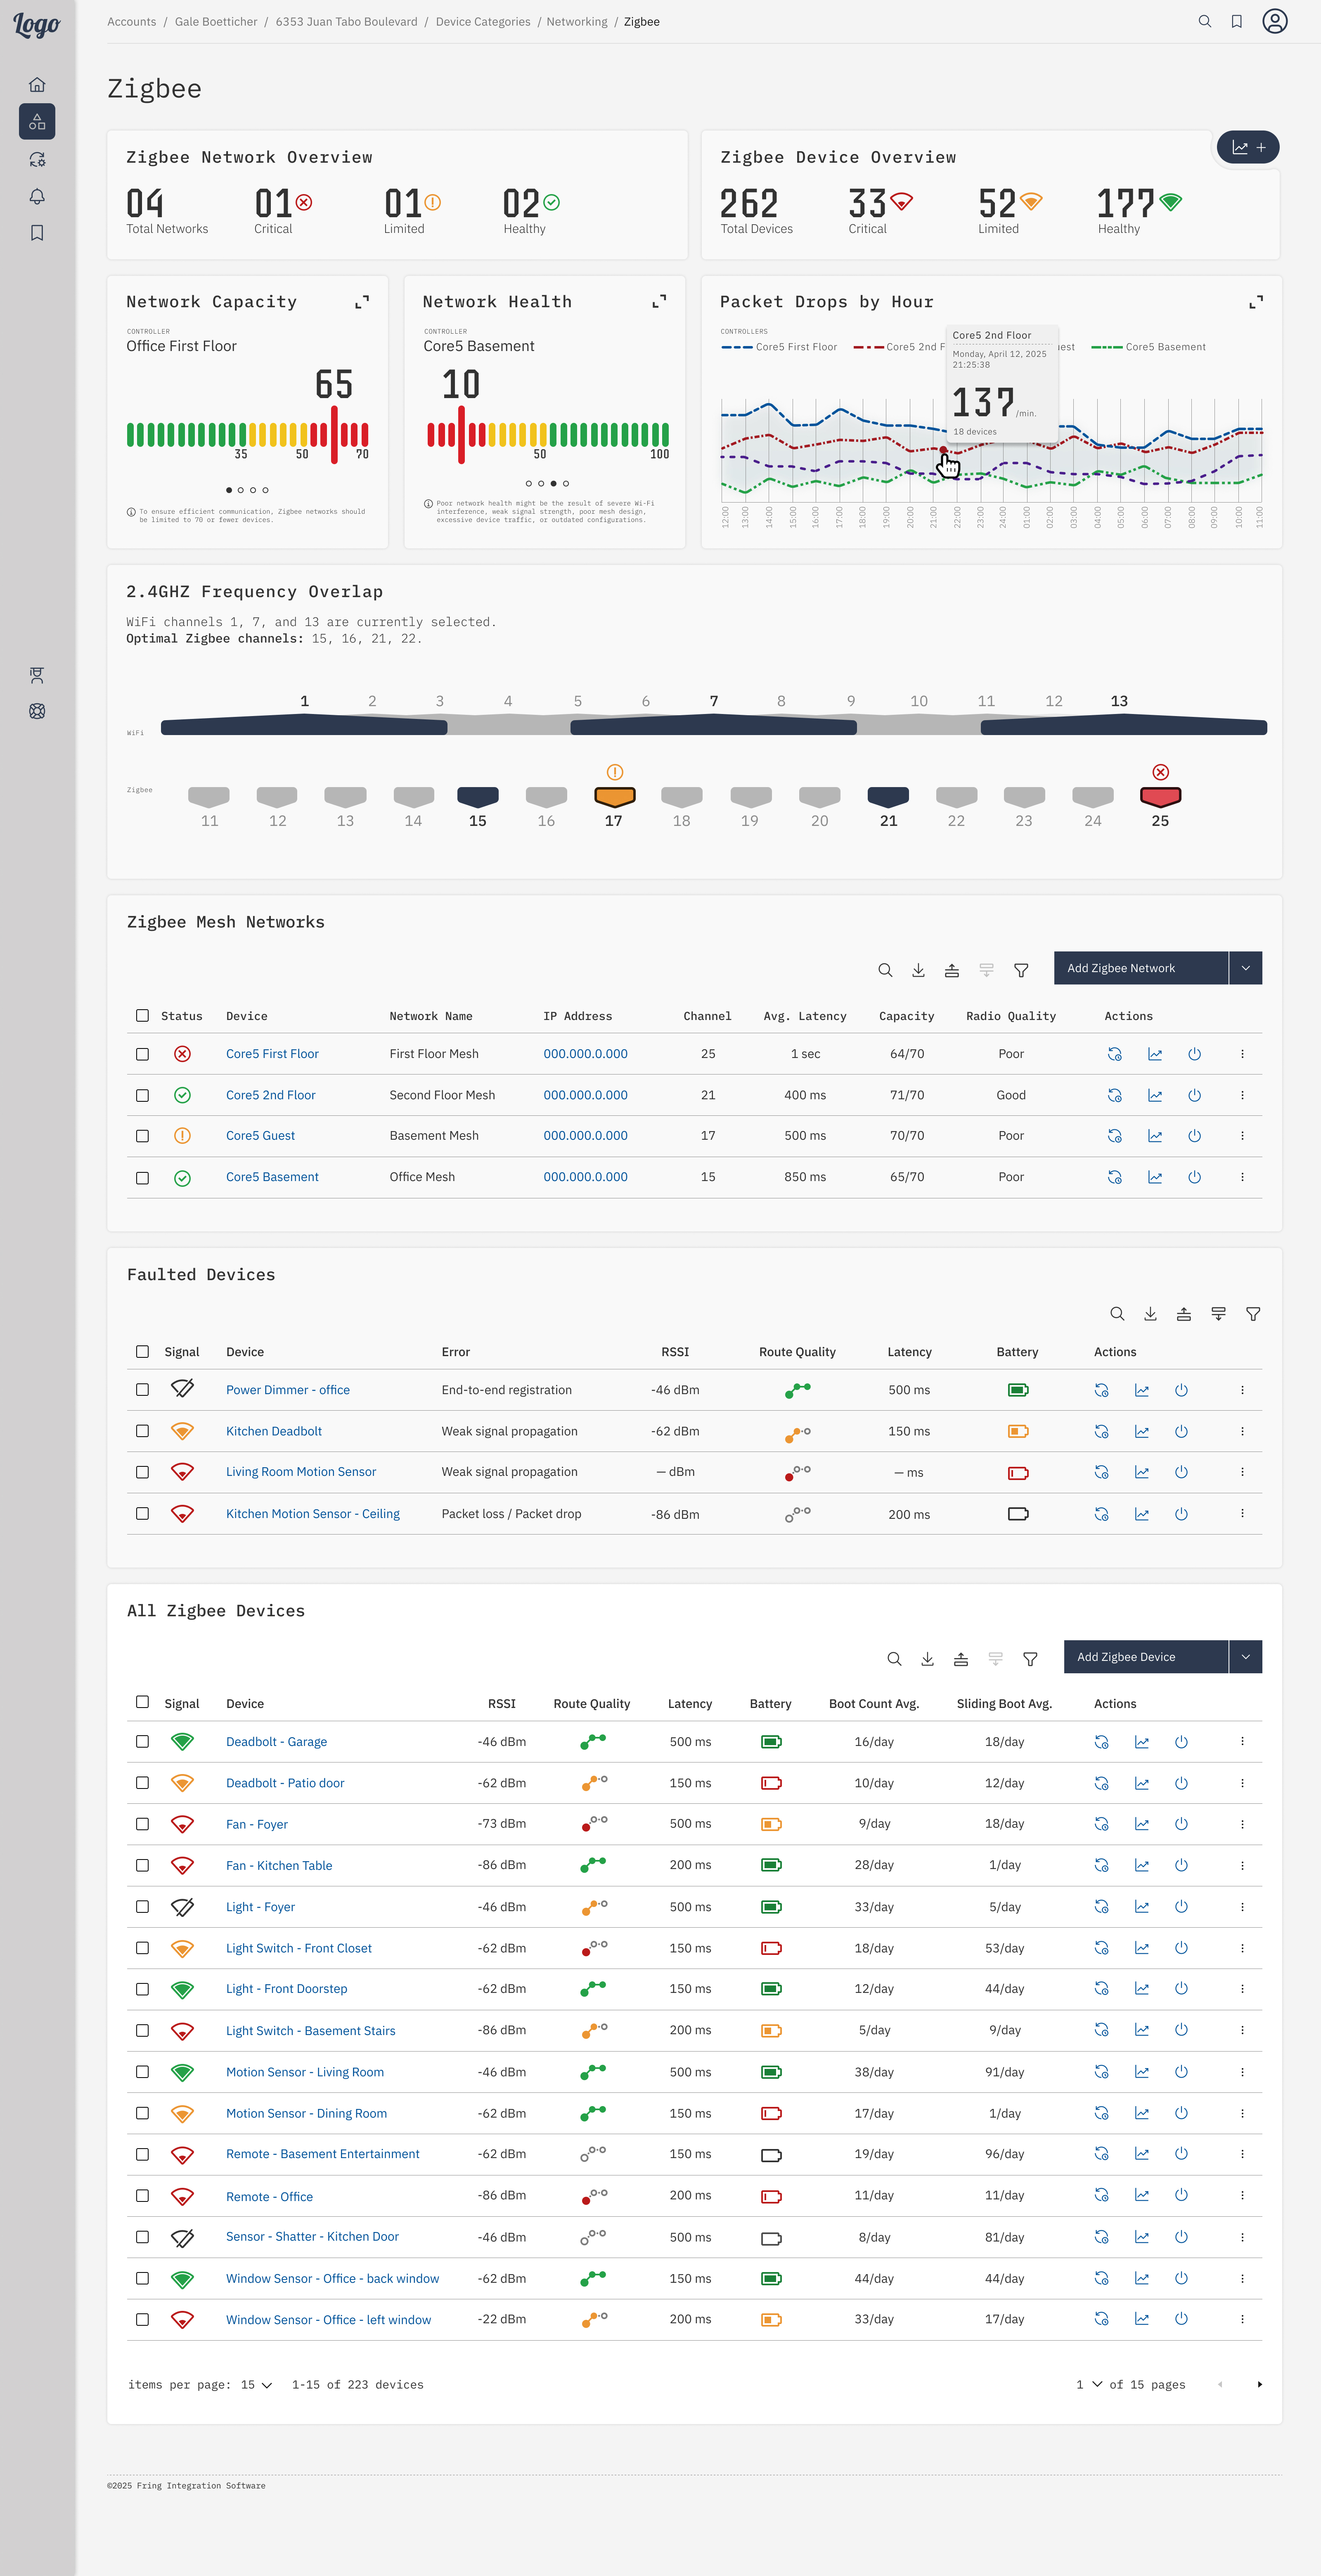
To address concerns that excessive color might be distracting, a user survey was conducted to compare color-coded icons (by severity) with black-and-white icons.

Results showed that 90% of participants preferred color-coded icons, citing improved clarity and a more intuitive interface.
Full dashboard with Zigbee network health, packet drops, frequency overlap, mesh networks, and device diagnostics.Same Zigbee dashboard layout with slight visual variation in header theme, showing identical metrics and device data.

the final experience

Zigbee dashboard showing network/device health, frequency overlap, mesh and faulted devices, and signal diagnostics.
scrollable
Responsive Zigbee dashboard stacked for mobile, showing network health, frequency overlap, and device diagnostics.
scrollable
The “add metric” feature was not originally in scope, but it became a necessary addition.

This functionality enabled integrators to customize the page by adding or removing metrics, giving them control over how much information was displayed.

outcome

By centralizing Zigbee-specific insights and controls, the dashboard improved field performance, reduced setup complexity, and equipped support teams with actionable data for faster resolution.